Covid19 among vaccinated people
1 Introduction
Before the vaccines were made available, 0% of the Covid19 sick people were vaccinated. On the other hand, something weird is gonna happen the day the entire world is vaccinated against Covid19: 100% of the Covid19 sick people will be vaccinated against it. But how does the percentage of vaccinated and sick people varies between these two bounds?
2 Model
Let’s consider a population of \(N\) people. Among these people only vaccinated and non-vaccinated people exist. The percentage of vaccinated people is noted \(x\). Therefore, the number of vaccinated people is \(x \times N\) while the number of non-vaccinated people is \(\left(1-x\right) \times N\).
The French application “AntiCovid” provides the number of vaccinated and non-vaccinated people ending up in resuscitation service (RS) in the hospitals for 1 000 000 people in one week respectively. Today (22/08/2021) these two values are respectively \(P_V = 2.44\) and \(P_{NV} = 27.31\) i.e. the probability of going to RS is \(0.0244\%\) if you are vaccinated while it is of \(0.2731\%\) if you are not. The risk is 10 times bigger when someone is not vaccinated!
Therefore, the number of vaccinated people entering RS in the week is calculated as \(x \times N \times P_V\) while the number of non-vaccinated people entering RS in the week is calculated as \(\left(1-x\right) \times N \times P_{NV}\).
In the end, the percentage of vaccinated people entering RS is calculated as:
\[\begin{equation} \begin{aligned} R\left(x\right) &= \frac{x \times N \times P_V}{x \times N \times P_V + \left(1-x\right) \times N \times P_{NV}}\\ & = \frac{x \times P_V}{x \times P_V + \left(1-x\right) \times P_{NV}} \end{aligned} \tag{2.1} \end{equation}\]
One can see that the result is population size independent. The only unknown is the vaccination percentage among the population \(x\).
3 Results
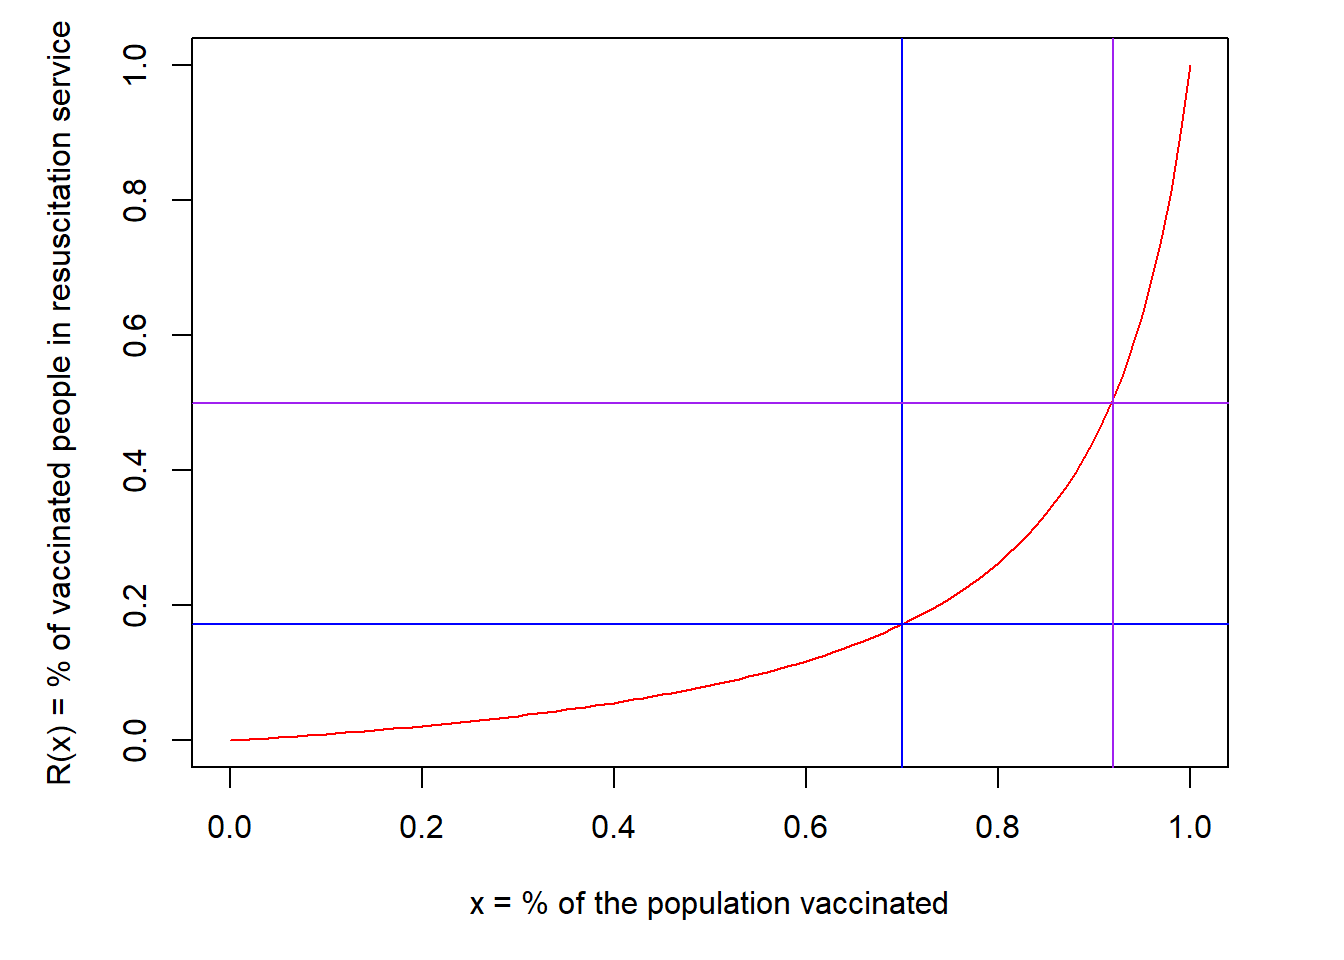
I plotted \(R\left(x\right)\) vs \(x\) on Figure 3.1. One can see that \(R\) slowly increases for low \(x\) values while an exponential increase is calculated for high \(x\) values. Today in France, 70.3% of the people have received at least one injection of a vaccine. This value is represented by the vertical blue line on Figure 3.1. One can read that for this percentage of vaccination, 17.5% of the people entering RS are vaccinated.

Figure 3.1: Evolution of the number of people vaccinated against Covid19 entering RS with respect to the vaccination percentage of the whole population.
According to a TV spot I saw today [1], the French government claims that 8 people over 10 entering RS are not vaccinated or equivalently that 20% of the people entering RS are vaccinated against Covid19. So there is a good agreement between the curve above and the government values.
My point is that the number of vaccinated people entering RS will drastically increase in the next weeks and their number will outclass the one of non-vaccinated people once more than 90% of the population is vaccinated (cf. purple lines on Figure 3.1). This is not a signal that the vaccines is no more working but that the vaccine has been injected to a large number of people.